World Cup Full Recap: $276.7M in Added Revenue, Higher Rates, Supply Kept Occupancy in Check
Linda Rollins
8/3/2026
This article was originally published on AirDNA’s website.
The largest tournament in FIFA history, spanning 39 days and 16 host cities across the United States, Canada, and Mexico, was expected to bring an immense boost to the travel industry, but the results were uneven. Airlines reported minimal impact, hotel occupancy slipped even as rates climbed, and international visitors never arrived at the scale many predicted.
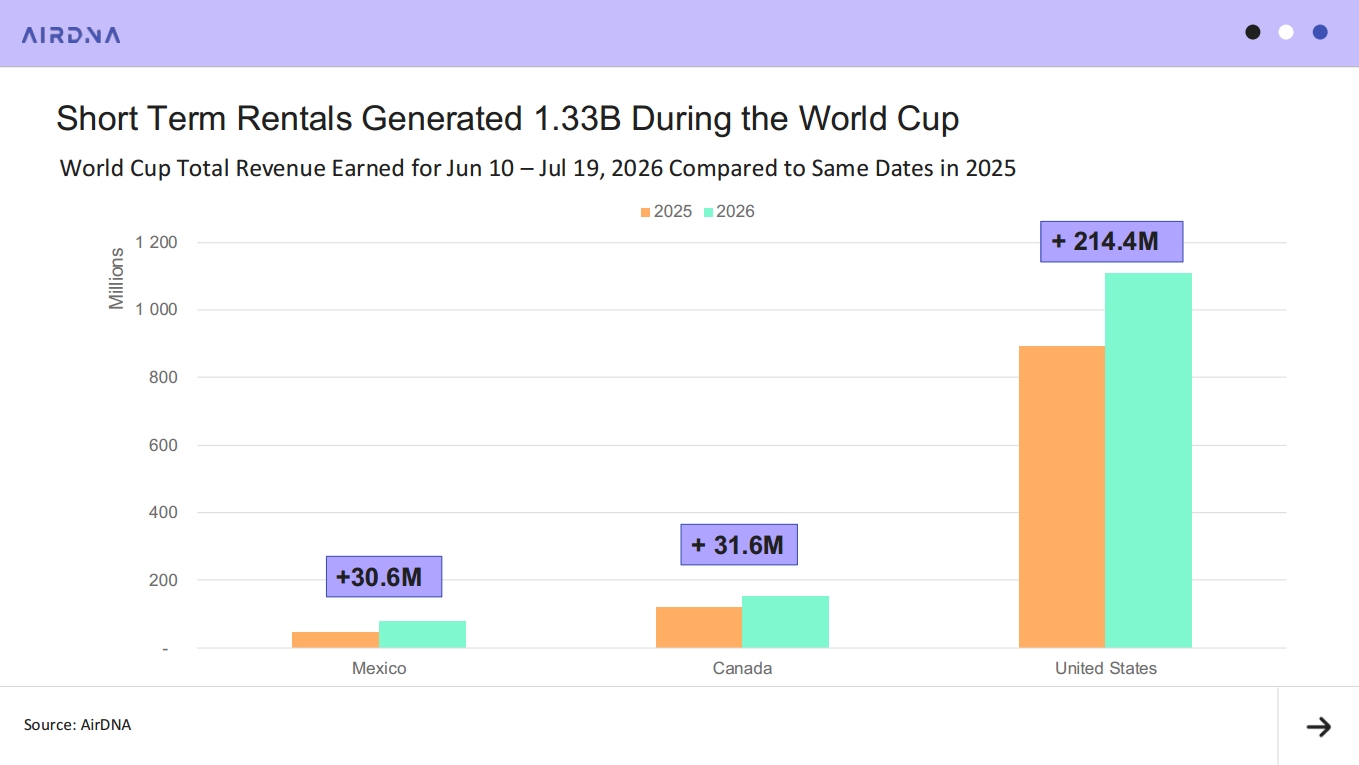
For short-term rentals, though, the tournament delivered. Across the 16 host cities, short-term rentals generated $1.33 billion in total revenue during the World Cup (June 10 to July 19, 2026), a 26% increase over the same period last year and an additional $276.7 million in revenue compared to 2025. The U.S. led with a lift of $214.4 million, followed by Canada ($31.6 million) and Mexico ($30.6 million).
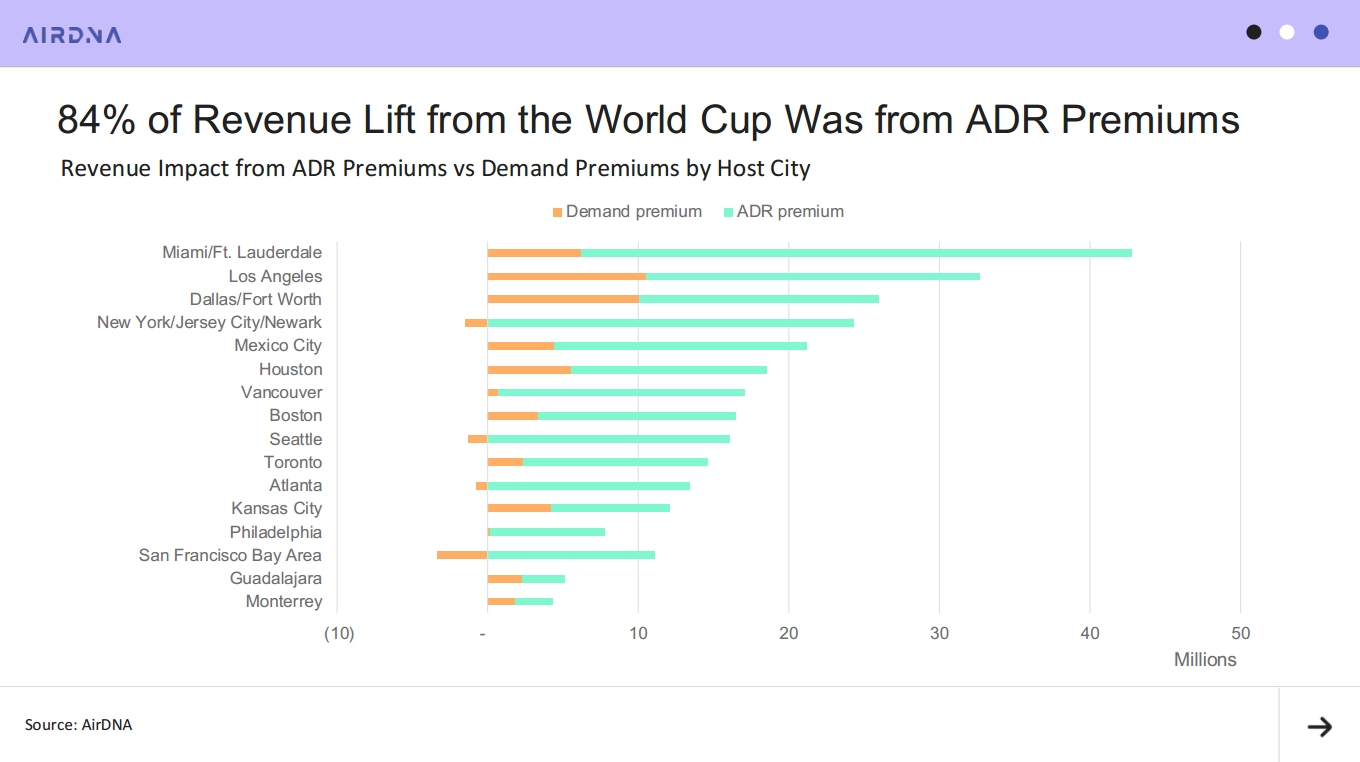
The more revealing number, though, is how that money was earned. The World Cup didn’t primarily fill more calendars; it let hosts charge more for the nights they were already booking. Of the $276.7 million revenue lift, $231.8 million, or 84%, came from hosts commanding higher nightly rates. Additional nights booked contributed just $44.9 million, or 16%. And this held true everywhere: In every one of the 16 host cities, average daily rate (ADR) premiums drove larger revenue gains than demand did. For hosts, the World Cup was less a demand event than a pricing event.
Four markets captured the largest share of the total revenue lift: Miami ($42.7 million), Los Angeles ($32.7 million), Dallas/Fort Worth ($26 million), and New York/Jersey City/Newark ($22.8 million). That’s no surprise, as these are the largest STR markets among the host cities, and small percentage gains on a big base produce big dollar figures. The more dramatic performance numbers came from the smallest markets, where the World Cup nearly doubled total revenue in Monterrey, Mexico (+96% YoY), Guadalajara, Mexico (+91%), and Kansas City, Missouri (+88%).
The spread, from single-digit growth in some markets to near-doubling in others, is the real story of this World Cup. In this article, we’ll break down what drove the differences: where demand actually grew, why it didn’t translate to occupancy gains in most cities, and where hosts won on price. Then we’ll get down to the match level: why star-powered group stage games outperformed the knockout rounds, and how Argentina’s fans and the final rewrote booking patterns in Atlanta and New York.
Mexico’s Host Cities Led the Pack in Demand Gains
Since most cities hosted games through the Round of 16, and Canada and Mexico stopped hosting after that point, we’ll focus on performance between June 10 and July 7 in the next few sections before diving into the final rounds.
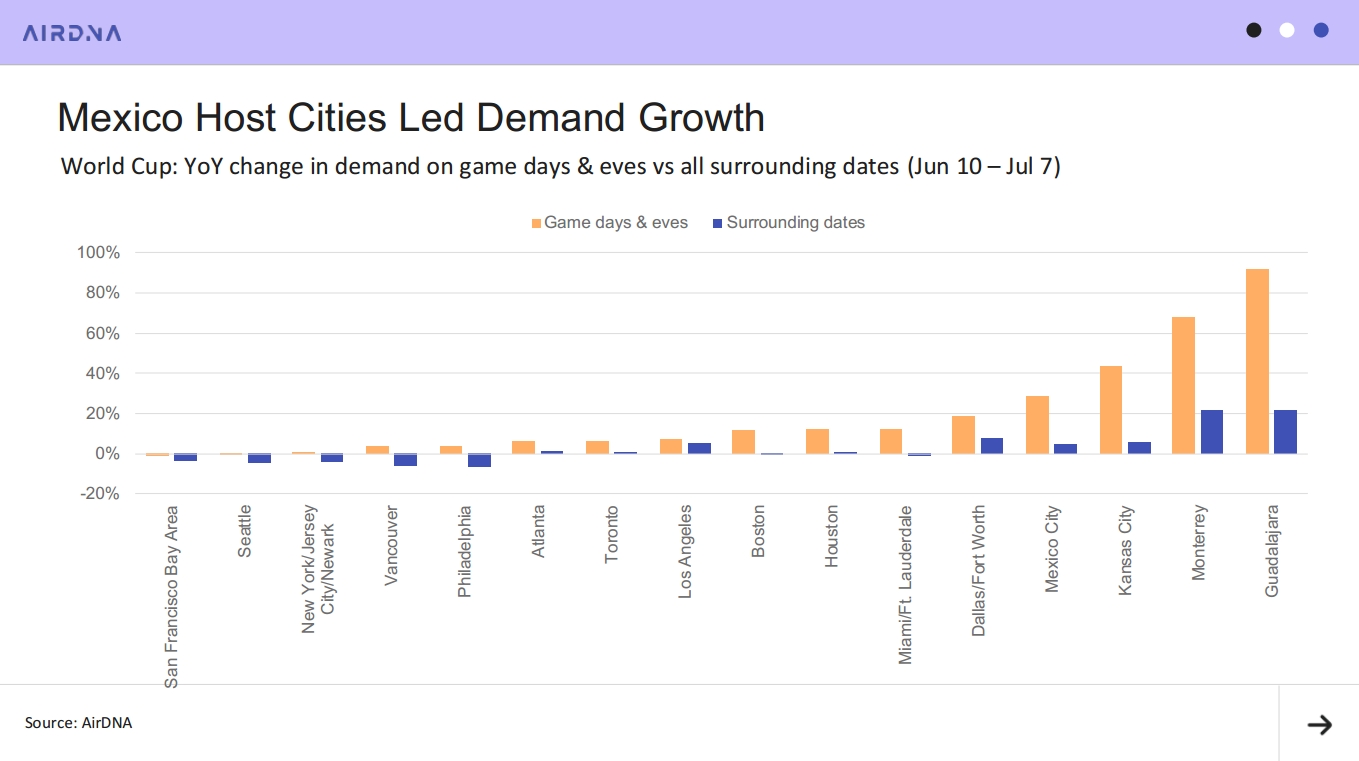
Across host cities, demand gains were stronger on game days and eves than outside of them. Mexico’s host cities led with the strongest YoY demand growth. On match days and eves, demand was up 92% year-over-year (YoY) in Guadalajara and 68% YoY in Monterrey. But even outside of match days and eves, total demand nights were still up 22% YoY in both cities. Guests traveling to these cities extended their stays, driving strong gains particularly during the group stage period.
In the U.S., Kansas City and Dallas/Fort Worth posted some of the largest demand gains on game days and eves, but those gains didn’t carry over to surrounding dates. In Kansas City, demand on game days and eves rose 43% YoY, yet demand outside of those windows was up just 6% YoY. Dallas/Fort Worth saw a similar split: Demand on game days and eves was up 19% YoY, while surrounding dates saw an 8% YoY increase in demand. In Miami, Houston, and Boston, demand was up 12% YoY on game days and eves, but surrounding dates saw no demand uplift. For many of these major cities, the World Cup may have shifted normal travel demand away from surrounding dates and concentrated it on game days and eves.
Unfortunately, not all host cities came out ahead. New York/Jersey City/Newark, the San Francisco Bay Area, and Seattle all fell short, with no demand lift on game days and eves and demand on surrounding dates down 3% to 5% YoY.
Why Demand Growth Didn’t Move Occupancy
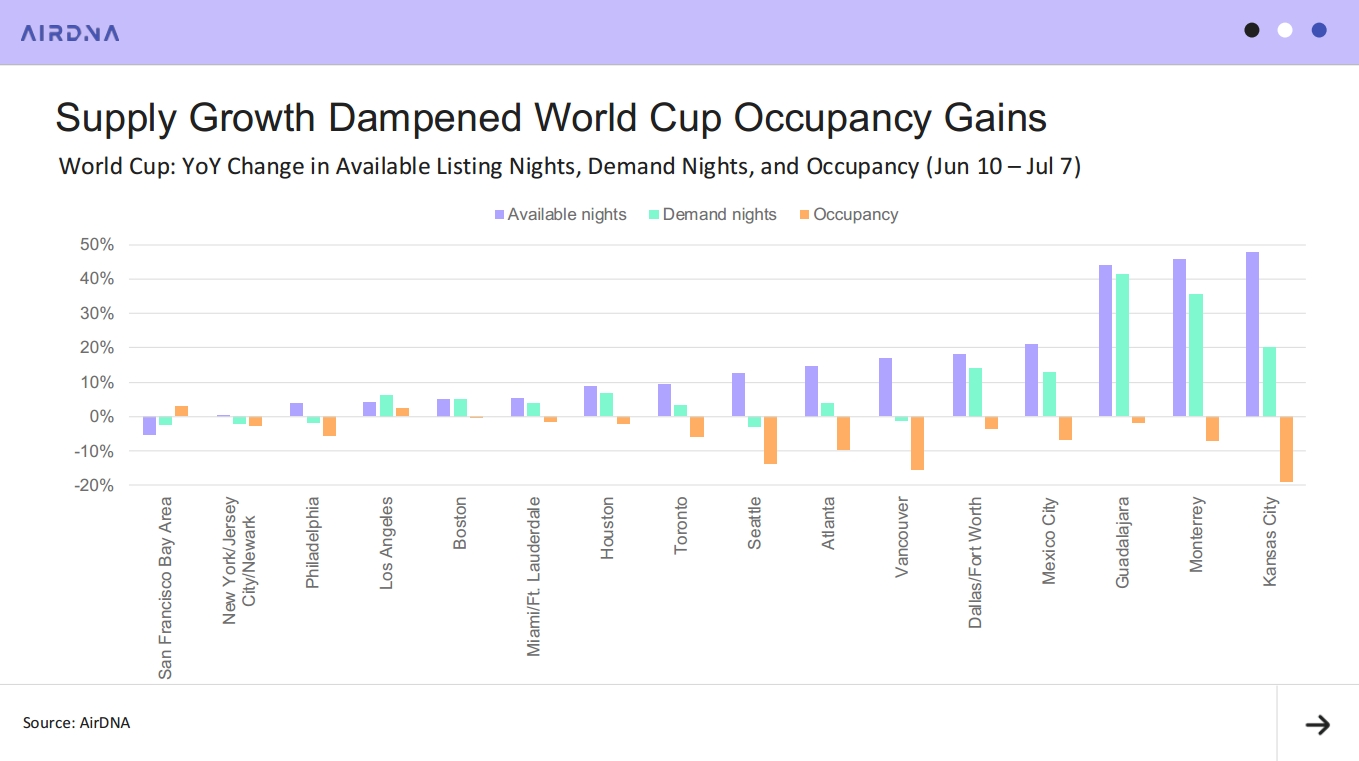
For most markets, despite demand gains, the World Cup did little to lift occupancy due to significant supply growth leading up to the tournament. New listings poured into host cities ahead of the event, and 12 of the 16 markets saw occupancy decline YoY as supply outpaced the demand the tournament brought in.
The trend was most pronounced in Kansas City. Demand nights there were up 20% YoY, but a 48% YoY surge in available supply nights pushed occupancy down 19% YoY. Seattle and Vancouver, Canada, told a similar story, with supply growth colliding with muted demand to produce YoY occupancy declines of roughly 15% in both markets.
Where Hosts Won on Price
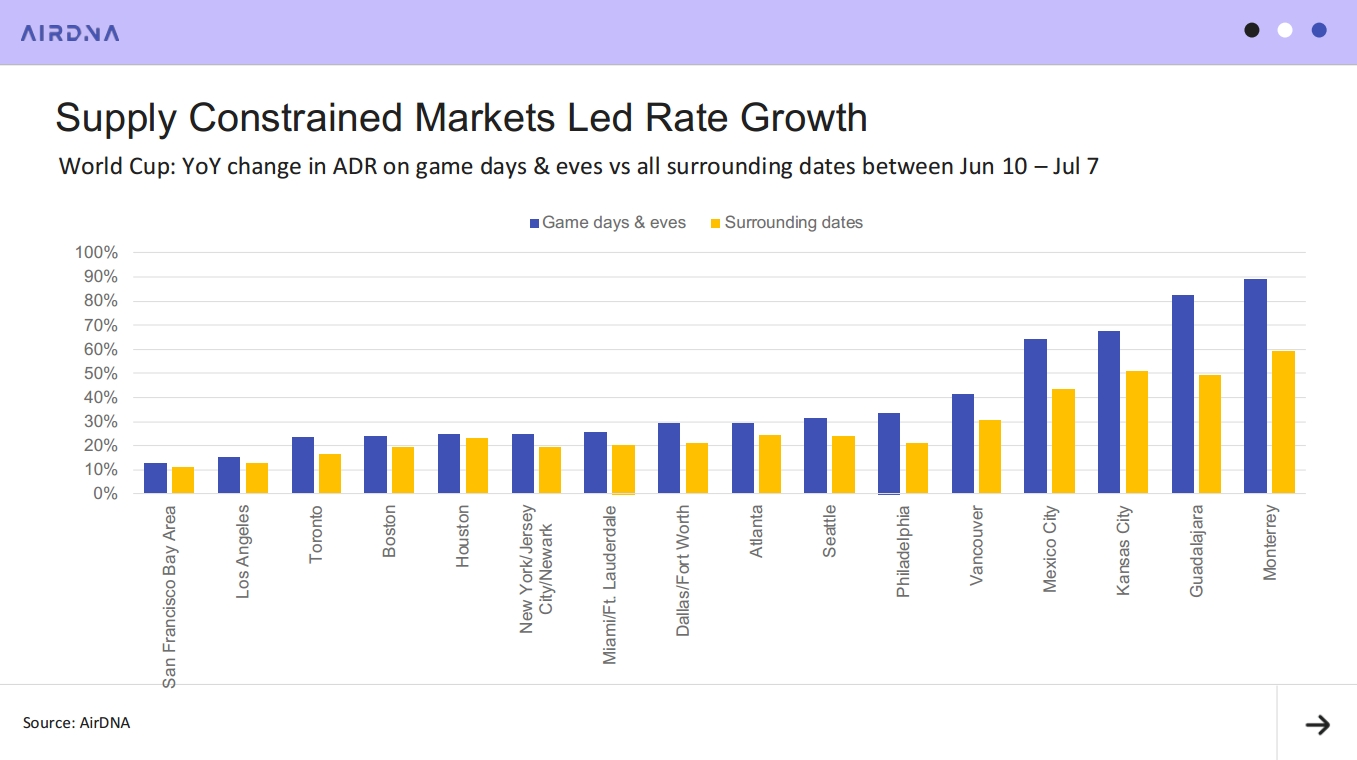
While most markets saw little occupancy upside, many still posted meaningful rate gains, both on match days and eves and on surrounding dates. Across host cities, 14 of the 16 saw booked rates rise more than 20% on game days and eves, and 13 of the 16 saw booked rates climb more than 20% on surrounding dates.
Supply-constrained markets saw the biggest gains. Booked rates in Guadalajara, Monterrey, Mexico City, and Kansas City were all up more than 60% YoY on game days and eves, and rates on surrounding dates were up more than 40% YoY in all four markets.
San Francisco and Los Angeles saw the weakest rate growth, with premiums coming in under 15%. A few markets (Philadelphia, Vancouver, and Seattle) posted strong gains exceeding 30% YoY on match days and eves but saw rate growth fall short on surrounding dates.
Star Matchups Drove the Biggest Gains
Occupancy and rate gains varied widely from match to match within each host city. In several cities, marquee group stage matchups delivered gains double those of less popular games and even exceeded the performance of later knockout rounds.
Miami is a clear example. Occupancy and rate gains for the Brazil vs. Scotland and Colombia vs. Portugal group stage games far outpaced the market’s other group stage matches and even exceeded performance for its Round of 32 (Argentina vs. Cape Verde) and quarterfinal (Norway vs. England) matches.
Houston followed the same pattern: Both of its Portugal matches drove occupancy and rate gains well above its other group stage games, as well as its Round of 32 (Brazil vs. Japan) and Round of 16 (Canada vs. Morocco) matches. Even in Los Angeles, where gains were modest relative to other host markets, the U.S. team’s matches took a clear lead, outperforming both Round of 32 matches and the Spain vs. Belgium quarterfinal.
Why Performance in the Early Rounds Beat the Knockout Rounds
Across most host cities, later-stage matches failed to outperform earlier rounds. The reason comes down to booking behavior. Because group stage matchups were determined well ahead of time, fans who wanted to see specific teams could plan and book far in advance, pushing up occupancy and rates. For knockout rounds, however, fans were more reluctant to commit when the teams wouldn’t be known until days before match day, and last-minute bookings weren’t enough to make up the difference, resulting in weaker gains despite the higher stakes.
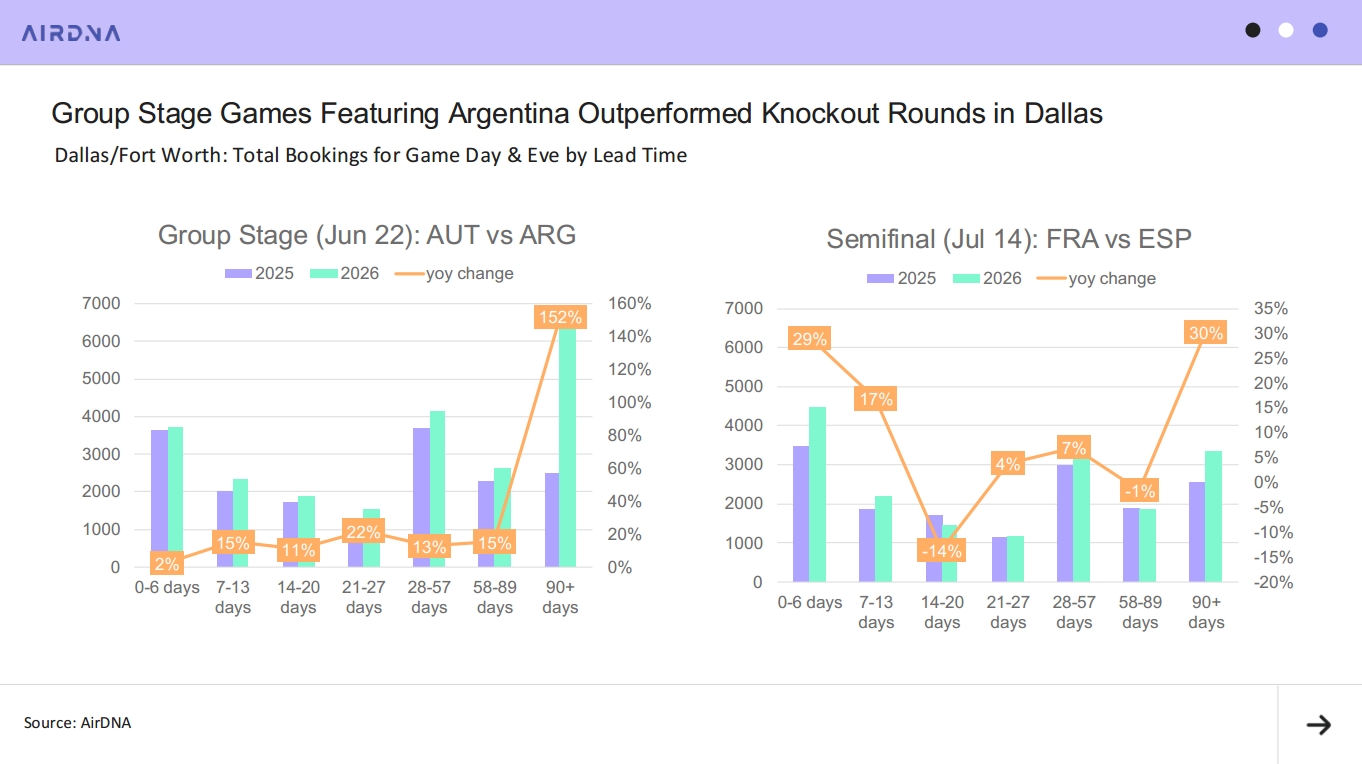
Dallas/Fort Worth illustrates this dynamic well. For the Austria vs. Argentina group stage game, fans booked far in advance for a chance to see Messi play. Bookings made more than 90 days in advance saw a 152% YoY increase, making up nearly 30% of all bookings for the match. Last-minute bookings within a week of the game saw only a 2% YoY increase.
Compare that to booking performance in Dallas for the France vs. Spain semifinal. Whereas the Austria vs. Argentina match saw more than 6,000 nights booked 90+ days out, the semifinal saw just 3,300, as fans waited for the matchup to be decided before booking. Bookings within two weeks of stay increased 25% YoY, but last-minute demand wasn’t enough to close the gap between the two games. Demand for the semifinal game was only up 14% YoY compared to 32% for the Austria vs. Argentina game.
Argentina Fans and the Final Rewrote the Patterns in Two Markets
Two markets bucked the trend and saw stronger performance in the knockout rounds.
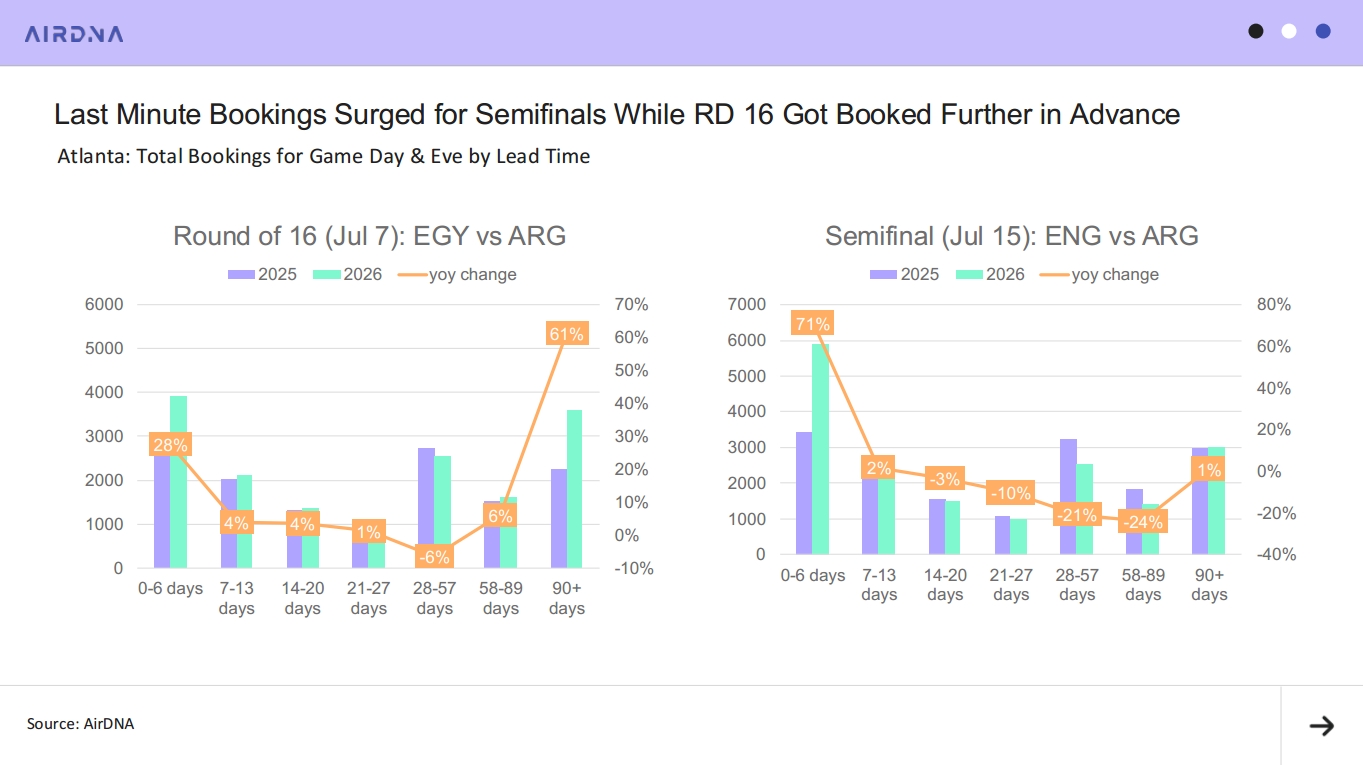
Atlanta’s knockout-round strength was driven largely by the devotion of Argentina fans. The Round of 16 game between Argentina and Egypt and the semifinal between England and Argentina were the only two matches in the market to post YoY occupancy gains. For the Egypt vs. Argentina match, fan confidence that Argentina would advance appears to have fueled a surge in early bookings. Demand nights booked more than 90 days out from the match increased 61% YoY. Last-minute bookers added to the tally as well, driving a 28% YoY increase in bookings made within a week of stay. Overall, demand for the match was up 16% YoY. The England vs. Argentina semifinal didn’t see the same early surge, but Argentina fans showed up en masse at the end: Bookings made within a week of stay jumped 71% YoY, lifting total demand 8% YoY.
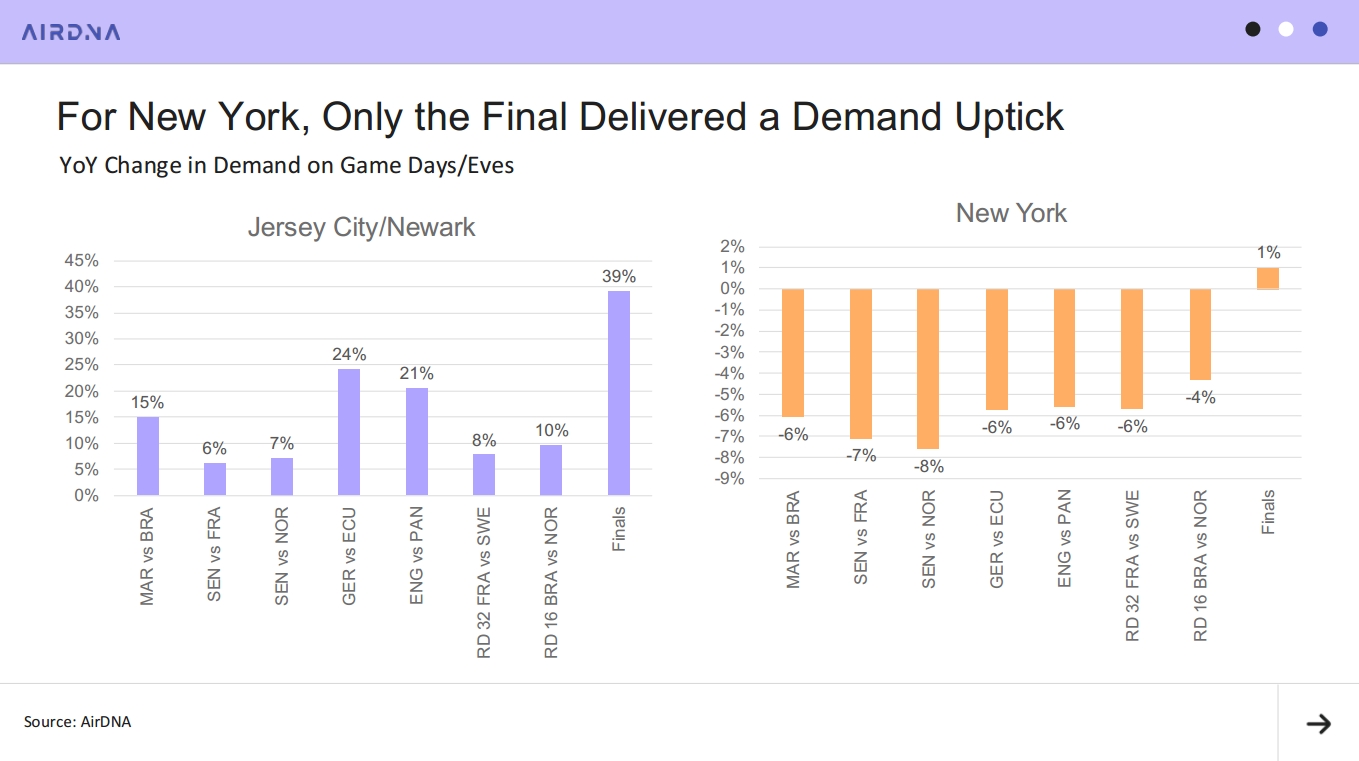
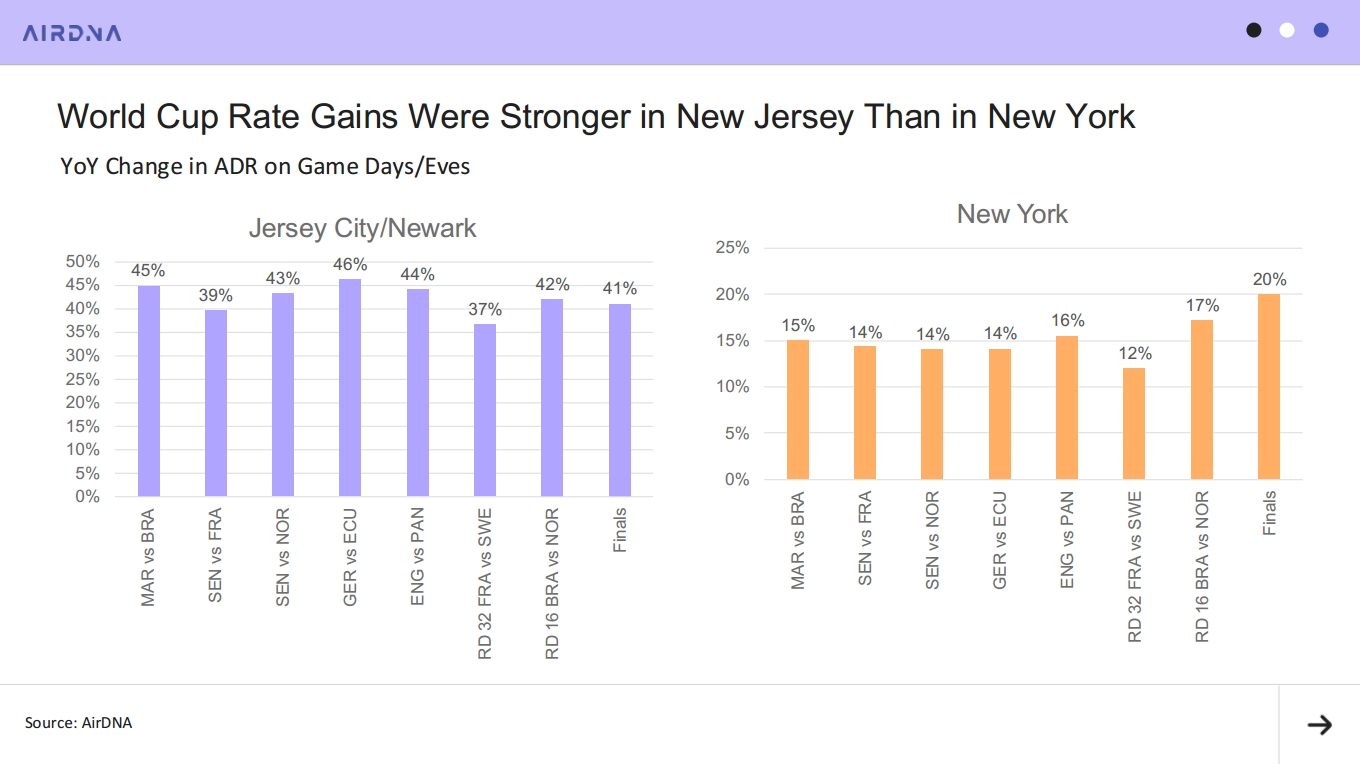
In New York, the World Cup Final brought the strongest demand and ADR lift to the market, capping off an otherwise weak World Cup performance. Looking at overall demand and rate performance for the New York and Jersey City/Newark markets combined, the gains were modest: Total demand increased just 2% YoY across game days and e——ves, while rates increased 25% YoY.
However, when we break out New York vs. Jersey City/Newark performance, it tells a tale of two cities. In Jersey City/Newark, the World Cup drove a 16% YoY increase in demand across game days and eves, with demand jumping 39% YoY for the World Cup Final. In New York, demand was down 4% to 8% YoY across World Cup matches, with the exception being the Final, where demand increased 1% YoY.
Rates tell the same story. Hosts in Jersey City and Newark saw booked rates climb 37% to 46% across World Cup matches, while New York’s rate growth was far more modest at around 15% across game days and eves. Once again, the Final was the exception, with New York posting a 20% YoY increase.
The Takeaway: The World Cup was a Rate Story, Not a Demand Story
The 2026 World Cup was a win for short-term rentals, but not the one many expected. The tournament didn’t flood host cities with a wave of incremental guests; instead, it gave hosts pricing power. With 84% of the $276.7 million revenue lift coming from higher nightly rates rather than additional nights booked, the World Cup rewarded hosts who priced with confidence far more than markets counting on an occupancy surge.
Beyond the numbers, the tournament revealed the anatomy of event-driven travel. Booking certainty mattered more than stakes: Fans committed early to known group stage matchups and hesitated on knockout games with unknown teams. Star power mattered more than round: a Messi group stage match outperformed a semifinal. And local supply conditions mattered more than event scale: the same tournament that pushed rates up more than 60% in supply-constrained markets like Guadalajara, Monterrey, and Kansas City couldn’t lift occupancy in a similar manner. Event demand has predictable patterns and hosts who learned them this summer will be ready when the next big event comes to town.
Linda Rollins
Linda Rollins is a data analyst at AirDNA, passionate about transforming complex datasets into clear, actionable insights that drive success in the short-term rental industry. Rollins combines technical skill with a knack for storytelling to help short-term rental investors and operators make confident decisions about their Airbnb businesses. She aspires to be a future short-term rental owner and enjoys spending time with her family, traveling, and looking for good eats.