Pacing for Vacation Rental Managers
3/2/2023
The summer of 2023 is just around the corner, but the outlook remains uncertain. As a property manager, you can prepare for these uncertainties by understanding how your portfolio and market is pacing.
What Is Pacing?
Pacing is a commonly used term in revenue management that helps managers understand how their portfolio or market is doing for a specific arrival date or time period. With this understanding, vacation rental managers can better analyze their performance, and compare and identify if the growth (or slowdown) they see is specific to their properties or a market phenomenon.
Usually, you’ll hear the terms “pacing ahead” or “pacing behind.” Pacing ahead is used when a portfolio or market is booking faster, and pacing behind is used when it’s booking slower.
Some examples:
- For a future date – June 20, 2023 – As of February 22, 2023, the market is 20 percent occupied, and for June 20, 2022, as of February 22, 2022, the market was 10 percent occupied. So, we’d say that this year the market is pacing ahead for June 20, 2023.
- For a future date – June 20, 2023 – Your portfolio is 20% occupied, and the market (or your compset) is 10 percent occupied. You’d say that your portfolio is pacing ahead of the market.
How to Use Pacing Data for Your Vacation Rental Portfolio
Here is how vacation rental managers use pacing data:
1. Same Time Last Year (STLY) Pacing – Occupancy
You can check the occupancy rates (as of today) for any future arrival date in your market and compare them with the same time last year (as of today’s date last year). Doing this helps you understand current demand trends for a particular listing or market segment relative to last year’s reference. Of course, you can do the same for your portfolio as well.
For example: For a future date – Jun 20, 2023 – As of February 22, 2023, the market is 20 percent occupied and for June 20, 2022 – as of Feb 22, 2022, the market was 10 percent occupied.
Suppose the pacing curve for your portfolio is above your reference point (your portfolio’s occupancy same time last year); in that case, you may have an opportunity to list your property for slightly higher nightly rates.
Conversely, listing performance lower than the reference point can indicate excessive rates or other factors you need to focus on to boost demand. With this method, you can also identify specific dates with historically higher or lower demand and use this information to set prices accordingly.
2. Competitor Pacing – Occupancy
You can check the occupancy rates (as of today) for any future arrival date for your portfolio and compare them with how your market or customized competition set is doing.
If you are pacing ahead of the market, you may want to increase your rates; and if you are pacing behind the market, you should analyze what factors (price or others) could affect this. For far-out dates, it’s generally a good practice to pace a little behind the market, as you don’t want to be among the first to sell.
3. Pacing (Comparison) – Average Daily Rate
The use of the term “pacing” to compare the average daily rate (ADR) is argued in the revenue management fraternity. But the concept remains valid.
By pacing your property against the market and its performance in the previous year, you can identify the rate guests are booking properties similar to yours or at what rate bookings were made last year. This way, you can optimize your pricing by charging guests the nightly rates they are willing to book for each date.
How Is Pacing Against Your Portfolio Different From Pacing Against the Market?
1. Pacing Against Your Portfolio
Pacing against your portfolio means looking at your historical data. It primarily means comparing a property’s occupancy and revenue for a specific period compared to last year.
However, historical data may lose relevance when the demand shifts and forges new expectations from the market. In this case, future market insights become more reliable. This is where looking at pickup data becomes crucial: “Pickup” in vacation rental revenue management refers to the occupancy achieved within a specified period of time. It tracks progress toward revenue goals and adjusts pricing or distribution. For example, if five out of 10 rental units are booked in the last seven days, the seven-day pickup is 50 percent.
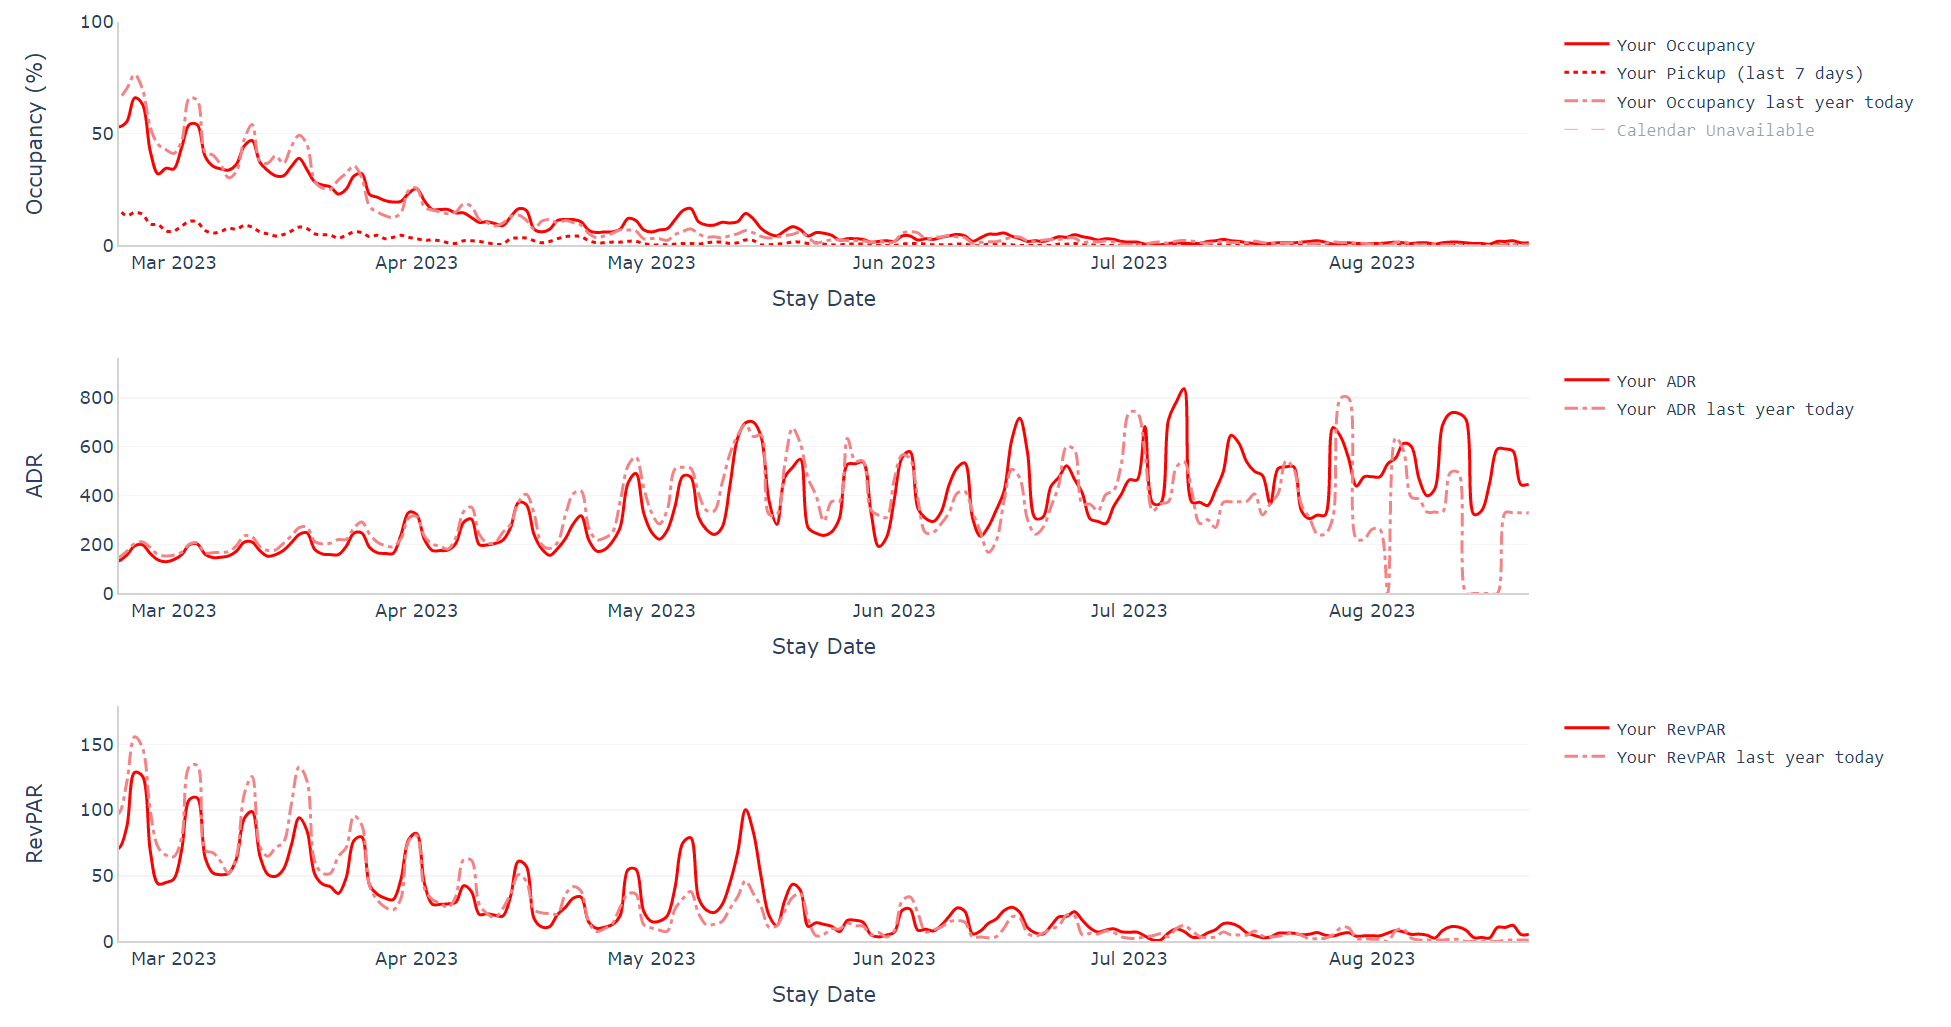
Below is a screenshot from PriceLabs’ Portfolio Analytics tool that shows the performance of a portfolio compared with last year.

2. Pacing Against Your Market
Pacing against the market helps you understand your competitors' booking patterns, ADR, and occupancy rates and gives you insight into future booking trends. The pickup rate plays a crucial role in pacing against your market in vacation rental revenue management. It refers to the rate at which reservations are made for a specific time period.
Property managers can determine if their pricing and marketing strategies are effective by comparing a property’s pickup rate to similar properties in the surrounding area. If the pickup rate is lower than that of comparable properties, it may indicate that adjustments need to be made to pricing or marketing tactics.
On the other hand, if the pickup rate is higher, it may suggest that the property is priced too low or needs to be marketed more effectively. Therefore, monitoring and analyzing pickup rates is essential for optimizing revenue and staying competitive in the vacation rental market.
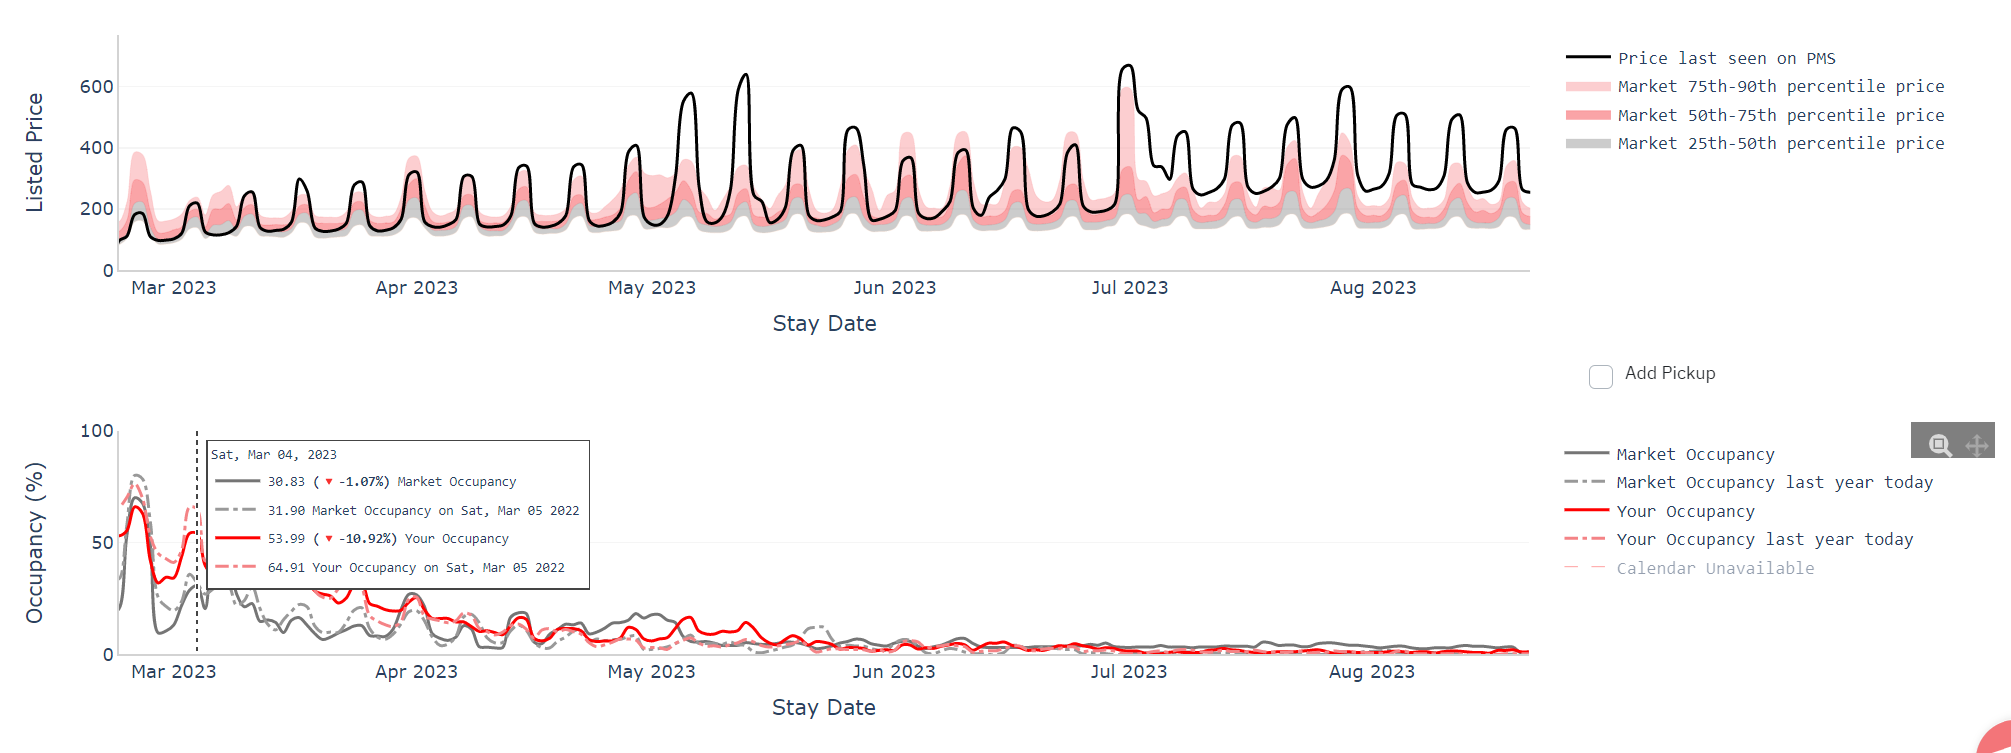
Here is an example of market pacing compared to a portfolio from PriceLabs’ Portfolio Analytics tool. Here you can also see how your listed price compares to the market.

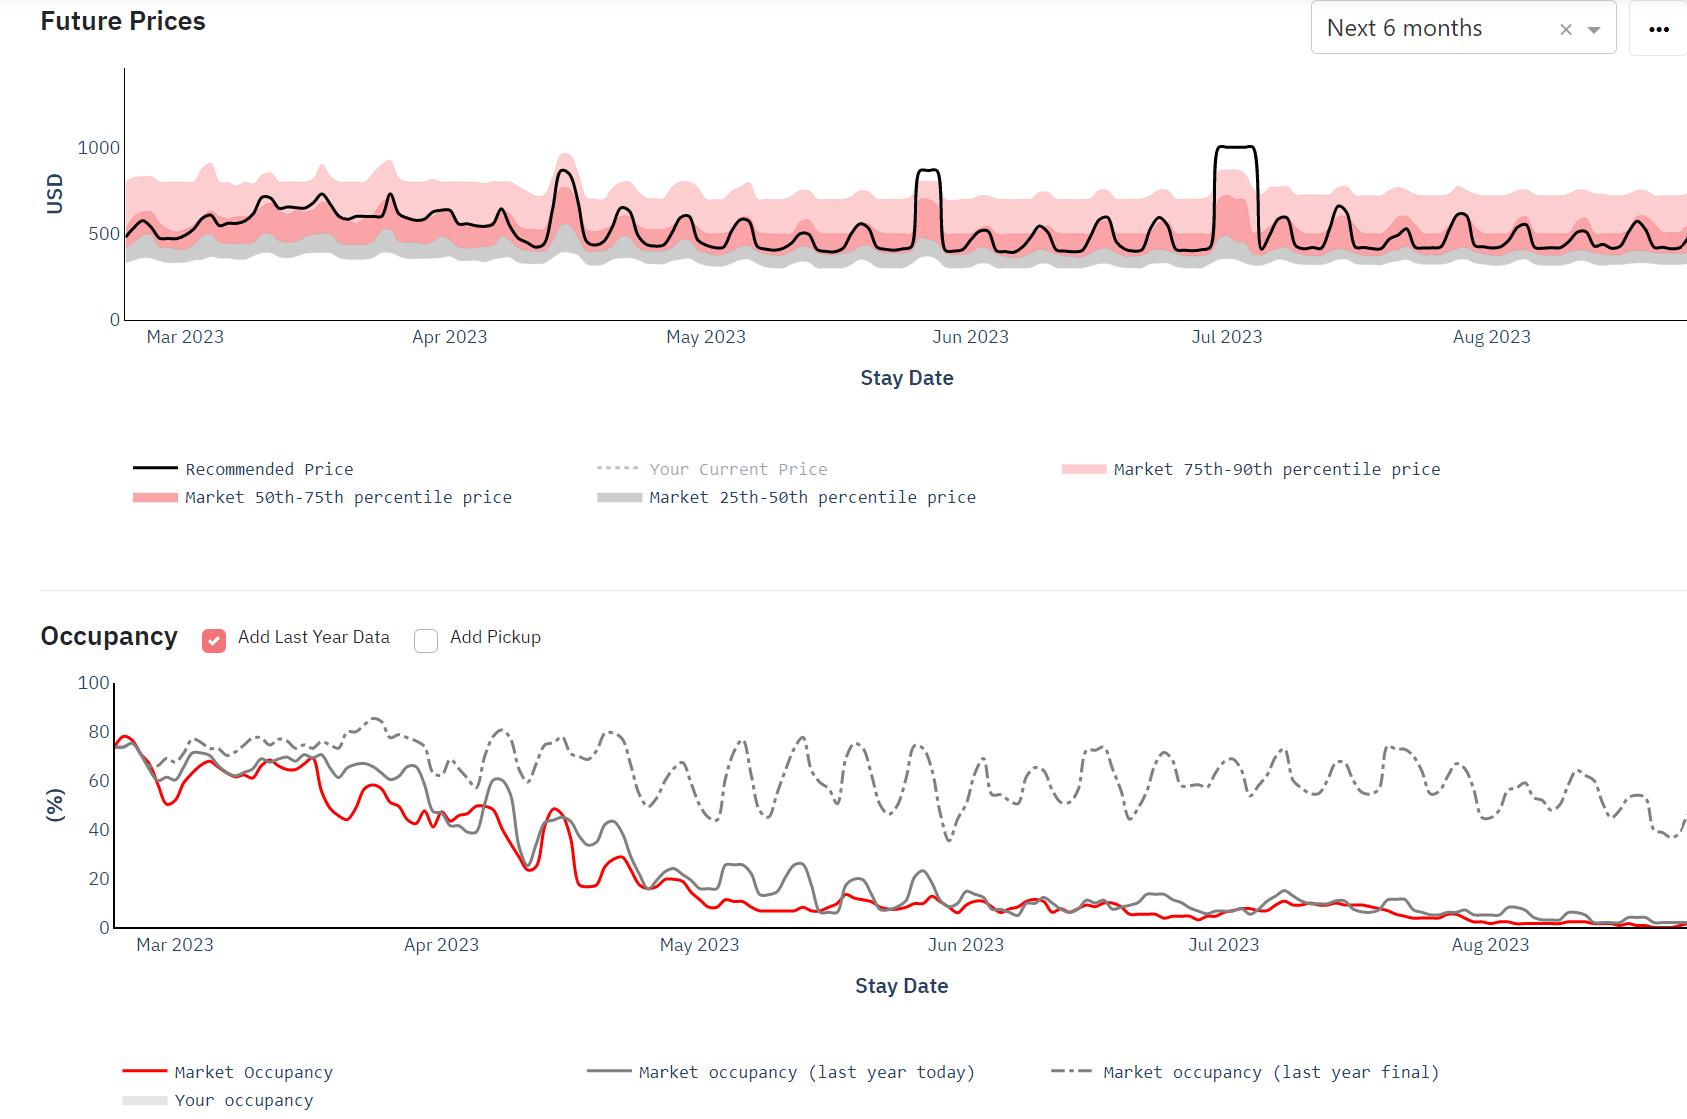
Very similarly with PriceLabs’ Neighborhood Data, you can see future prices and occupancy for the surrounding market against a listing’s prices and occupancy.

Why Did PriceLabs Add More Pacing Curves?
PriceLabs understands the needs of vacation rental managers due to changing market conditions. Adding this new pacing feature helps property managers draw helpful insights from their competitors. PriceLabs’ algorithm also considers market pacing to adjust prices year over year.
As a vacation rental manager, you can quickly and easily identify whether your listings, local competitors, or an entire market are slowing down or booming compared to last year. You can do this with Market Dashboards, the Portfolio Analytics tool, and Neighborhood Data. A downloadable PDF report is also available at the end of the charts to share with your property owners. In addition, you can sign up for PriceLabs and get a free one-month subscription.