Three Tips to Optimize Your Vacation Rental Website
4/15/2022
Sponsored by Atlas
The team at Atlas, TravelNet Solutions’ digital commerce division, are hospitality website experts. To that end, we often refer to “high-converting” or “high-performing” websites. But what does that really mean, and how do you get there?
First, let’s remind ourselves why a high-converting website is so critically important to the vacation rental industry.
- Direct bookings have higher margins. When you don’t have to pay for leads as you do with online travel agencies (OTAs), you make more money.
- You have more control. Your direct channel puts everything from relevant traffic to the booking engine in your hands. It’s more work, but it puts you in the pilot’s seat.
- They’re your leads. If you do a good job of capturing leads through your website, they are yours alone and you can market (or re-market) to that audience however you want.
With this context in mind, you can see how a high-converting website will make you more money and protect your revenues from ever-increasing commissions. But what’s involved? How do you know when you’re on the right track?
We’ve identified three high-level factors for improving your website’s revenue performance. These tips are just as handy if you run all your direct business in-house or if you hire out, so let’s dive in.
Tip 1: Be Data-Driven
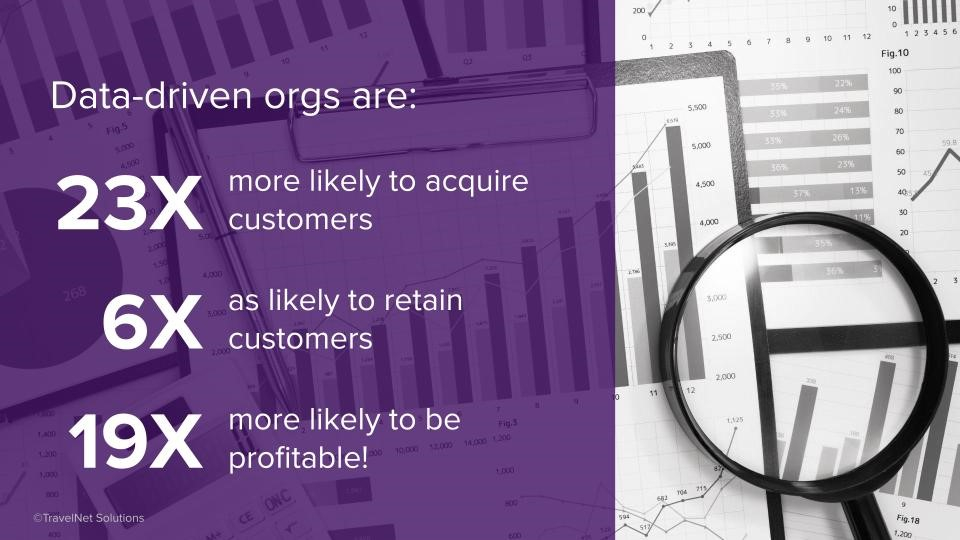
Lots of PMCs use data to drive decision-making, but website analytics often crosses a line into geeks-only territory. Indeed, if you’ve ever played around in Google Analytics, you’ve probably been more overwhelmed and confused than impressed.
Even so, there are a handful of key metrics that it pays to understand and watch. We recently looked at data from about 50 of our VR customers to establish some industry benchmarks around these metrics.
Five Key Website Metrics With Industry Averages
There are many relevant metrics, but these represent a baseline of information for data-driven decisions. We can dig into yours and identify areas for improvement, but looking at your numbers for a representative time frame, such as the past six months, can tell you a great deal about your direct channel’s overall health.
1. Load Time
Load time is expressed in seconds. Generally, you want your website to load in three seconds or less. Anything more and you risk losing half your audience to impatience.
A number of factors go into load time, from your hosting service (e.g., WPEngine, Bluehost) to the platform in which it was built (e.g., WordPress, Squarespace) to the size and quantity of the assets on your page (e.g., photos, video).
(Note: Many slow-loading websites also suffer from “code bloat,” which means they load a number of modules and libraries you don’t need before rendering your pages. A good developer can disable or remove these unnecessary components.)
Google Page Speed can run a free analysis of your website’s overall performance based on any page you choose (usually the homepage). This is often a good place to start.
2. Bounce Rate
Bounce rate is measured as a percentage. A bounce occurs when a visitor leaves from the same page they landed on. In other words, they use the page as both a jumping-in and jumping-off point without clicking on anything.
A bounce rate in excess of 60 percent is a red flag. There can be many reasons why visitors bounce out of a page but, often, it’s because they couldn’t find what they were looking for or it wasn’t clear what they were supposed to do.
We can help you identify the factors contributing to a high bounce rate, but a good benchmark for our industry is around 42.4 percent.
3. Pages/Session
Pages per session is expressed as a real number (e.g., 2.1). It is the number of pages viewed, on average, for a visitor to your site. The higher the number, the better because it means your website is engaging enough to click around and explore.
A low pages/session number isn’t necessarily bad. For example, if you have one main page with tons of great information, it will be low. The key is to correlate it with the time on page (yet another metric) to get the whole picture.
We’ve pegged the benchmark for pages/session at about four.
4. Average Session Duration
Put simply, this is the amount of time the average visitor spends on your website. Higher is usually better since it usually means the visitor found your content relevant. In our estimation, three-and-a-half minutes (3:30) is a good number to shoot for.
5. E-Commerce Conversion Rate
Expressed as a percentage, this tells you what percentage of visitors ultimately complete a booking through your website. It’s a measure of how well your website takes a visitor across the finish line and generates revenue.
If you’ve done any digital marketing, then you know this number is quite low, which makes it that much more important to execute across all these data points. A good conversion rate to target is around 0.52 percent. If you’re up around 1 percent or higher, pat yourself on the back because you are crushing it compared to your peers.
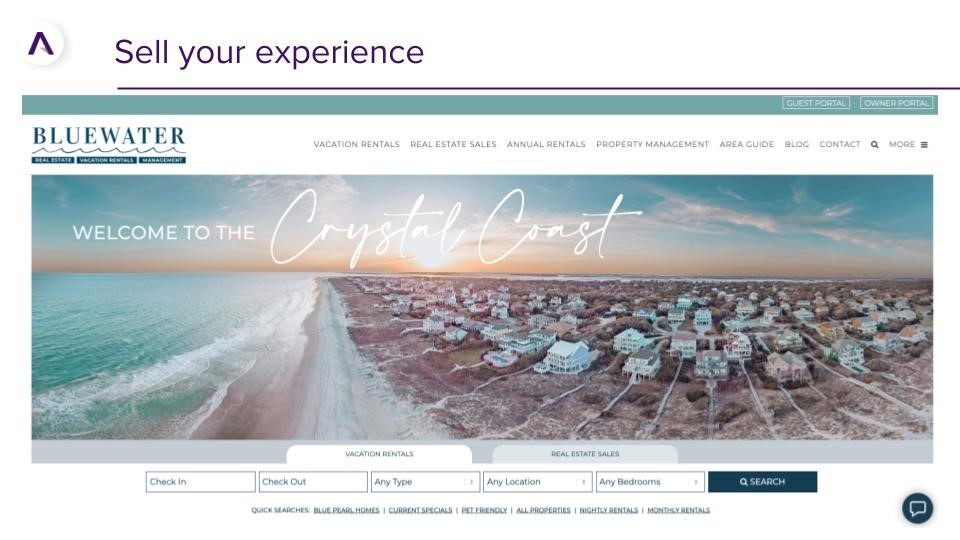
Tip 2: Resist the Urge to Over-Inform
Your properties are awesome. You’ve worked hard to provide a ton of value to your guests, and your bulleted list of 112 property features proves it. So do your 47 photos in a gallery that leaves no question as to what everything looks like. More is better, right?
You know that saying about the shortest distance between two points?
It can be hard to move property features and in-depth details off your main pages, but it’s a must. Your goal should be to make it as easy and straightforward as possible to book with you. That means shortening the distance between a visit to your website and a booking. Reduce “feature bloat” and watch your conversions improve. The OTAs spend millions perfecting conversions, so those websites can provide great information.
Tip 3: Don’t Forget to Market Your Destination
In general, there are two types of short-term rental customers: Those who come mainly for the destination and those who come for lifestyle experiences in or around the destination. Lodging rarely comes first, which is why you must tightly connect your brand to the destination and its experiences.
Put another way, it’s not about you.
Don’t get us wrong. You can and should market yourself because you still must compete for heads in beds, but your website isn’t the place for it. If they’re on your website, your marketing has already done its job, so shift the focus toward the destination and its experiences. Highlight how close you are to shuttle stops or the gondola. Position yourself as the clear choice for a lodging provider that will complement the guest’s actual reasons for visiting.
Your focus on the destination shouldn’t stop with your website, either. Email sequences to booked guests are a great way to highlight your knowledge of the area with “insider” information, such as the best times to visit popular landmarks or “hidden gems.” Consider partnering with area service providers to offer unadvertised discounts exclusively for guests to add some unexpected value (and an extra touch!) between booking and check-in.
Small Improvements Can Make a Difference
Your direct channel, aka your website, can always be better. But in the world of analytics, small improvements can make a big difference, especially with the metrics we mentioned in this article. Each one plays a supporting role in boosting your conversions and widening the gap between what you make on a direct booking versus one from an OTA. That’s what you want, and that’s where you need an edge.
The good news is, you don’t need to know it all. The team at Atlas has built more than 400 websites for PMCs of all sizes and seasons, and we know what works. It all starts by knowing where you stand relative to the competition and what kind of impact key improvements might have.
If you’re curious to learn where you can improve, reach out to the Atlas team for a free, no-obligation website analysis.